Observer
The Datalayer Observer Helm Chart installs the needed Observability tooling for the Datalayer Platform to be operated in production.
- Loki is used to gather logs of all the services in a central place.
- Tempo is used to gather traces.
- Prometheus is used to gather metrics.
- Prometheus Alert Manager is used to create and manage the alerts.
- OpenTelemetry Collector used as Kubernetes Deployment to proxy metrics and traces from Datalayer services to Prometheus and Tempo and also used as Kubernetes Daemonset to parse pod log files and send them to Loki.
- Grafana is used to visualize and analyze the gathered information.
Install
plane up datalayer-observer
The first time, you will likely get an error preventing the Opentelemetry collectors to be created. Executing the up command a second time should pass.
If you face some issues due to the OpenTelemetry operator, it is likely related to the CRDs being undefined in the cluster. You can install them manually from plane/etc/helm/charts/datalayer-observer/charts/crds/crds.
Helm should install them the first time. But this is a complex thing to handle, see this link for more information.
The datalayer-observer chart deploys multiple subcharts:
- Kube Prometheus Stack chart.
- Prometheus Operator.
- Prometheus.
- Prometheus Node Exporter.
- AlertManager.
- Grafana.
- Loki chart.
- Tempo chart.
- OpenTelemetry Operator chart.
- Additional CRDs for OpenTelemetry.
The deployment will result in:
- An
OpenTelemetry Collectoras single Pod?Service to proxy the received traces and metrics to Prometheus and Tempo. - A
Log Collectoras Daemonset to parse the containers log files and proxy them to Loki. - A
Service Monitorto tell Prometheus to fetch the metrics:- From the
OpenTelemetry Collectorsingleton. - From the
Runtimes, we use the builtin Jupyter Server Prometheus endpoint.
- From the
- An
Ingressfor Grafana to be exposed in a similar way as the other Datalayer services. Cluster Rolesfor theCollectorsin order to use the Kubernetes API to fetch Pods and Nodes metadata to enrich the Telemetry metadata.
Uninstall
plane down datalayer-observer
The Opentelemetry collectors will unfortunately not be removed - the associated CRDs are failing to be deleted.
You will need to edit them manually to remove the finalizer as the OpenTelemetry operator is down.
Then normally all associated Pods should be removed.
If needed, you will have to force delete the datalayer-observer namespace.
Metadata
OpenTelemetry requires the services to be distinguished using a triplet (service.name, service.namespace, service.instance.id) - only the first one is mandatory. But Prometheus requires services to be distinguished using a doublet (job | pod, instance).
Therefore, as recommended in OpenTelemetry documentation, the following mapping is applied: job == service.namespace; instance == service.instance.id.
Those metadata are set from:
service.name:- Enforce on telemetry send by datalayer services
- Extracted from container name for logs
service.namespace: Kubernetes namespaceservice.instance.id: Kubernetes pod id
The other metadata normalized (in Loki, Tempo and Prometheus) are:
app: Kubernetes pod labeldatalayer.io/appnamespace: Kubernetes namespacepod: Kubernetes pod namecluster: Value from$DATALAYER_RUN_HOSTinstance: Kubernetes instance
For the Runtimes, the following metadata are also added:
datalayer.pool.name: Kubernetes labeljupyterpool.datalayer.io/namedatalayer.pool.status: Kubernetes labeljupyterpool.datalayer.io/pod-statusdatalayer.pool.user: Kubernetes labeljupyterpool.datalayer.io/user-uiddatalayer.pool.type: Kubernetes labeljupyterpool.datalayer.io/kernel-typedatalayer.pool.reservation: Kubernetes labeljupyterpool.datalayer.io/reservation-id
Prometheus
Prometheus gets its data source definition from CRDs PodMonitor and ServiceMonitor.
Third-parties that don't support OpenTelemetry metrics use such monitors and therefore are not proxied by the OpenTelemetry collector.
ServiceMonitor- Used by Grafana, AlertManager, Loki, Tempo, Prometheus, Prometheus Operator, Prometheus Node Exporter and OpenTelemetry Collector singleton.
- To be detected by Prometheus the ServiceMonitor must have the two labels:
monitoring.datalayer.io/enabled: true
monitoring.datalayer.io/instance: "observer"
-
Kubernetes metrics are also gathered through service monitors defined in the kube-prometheus-stack.
-
PodMonitor: used by Pulsar stack (default in the Helm Chart).- PodMonitor can be defined in any namespace
- To be detected by Prometheus the PodMonitor must have a label
app=pulsar. - Other values for the app label could be defined in the
kube-prometheus-stack.prometheus.prometheusSpec.podMonitorSelector.
app: pulsar
Instrumentation
Services
The services are instrumented explicitly using the code defined in datalayer_common.instrumentation as a custom version of the Python instrumentation ASGI was needed in particular to push the HTTP route metadata.
The logging instrumentor is used as by default it calls basicConfig. The service must not call it.
Configure the metrics and traces targets is done through environment variables.
export OTEL_SDK_DISABLED="true"
export OTEL_EXPORTER_OTLP_METRICS_ENDPOINT=http://datalayer-collector-collector.datalayer-observer.svc.cluster.local:4317
export OTEL_EXPORTER_OTLP_TRACES_ENDPOINT=http://datalayer-observer-tempo.datalayer-observer.svc.cluster.local:4317
Currently the data is sent using gRPC.
HTTP is also available but would require to change the instrumentation code as the library to use is different.
Runtimes
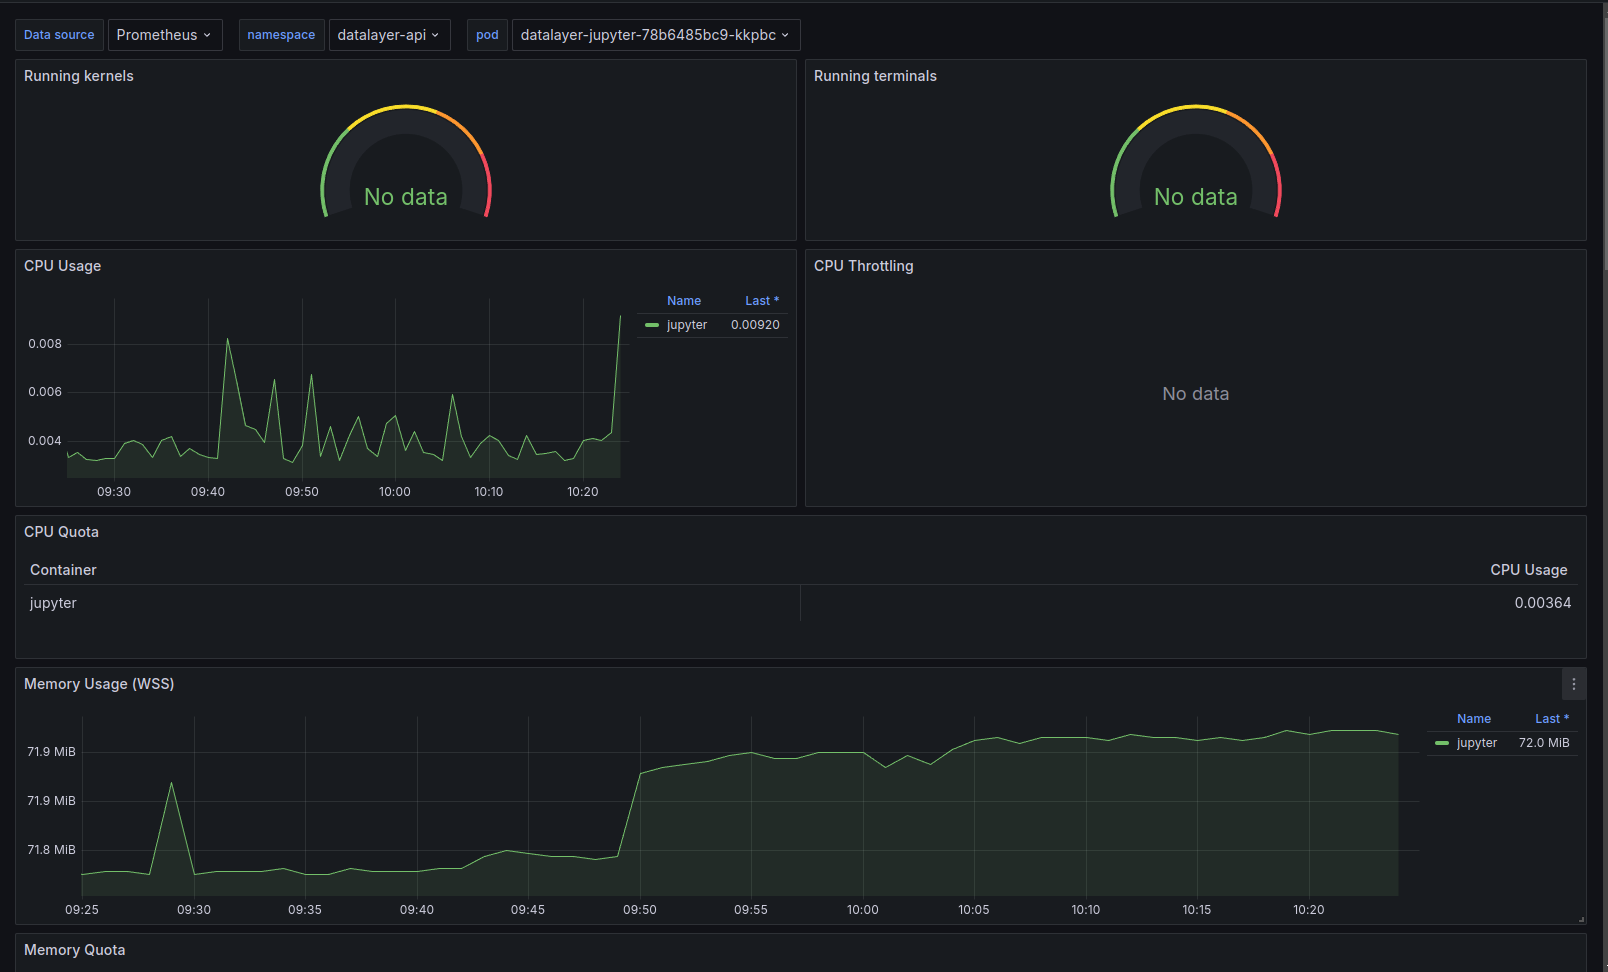
There is for now no custom instrumentation, nor custom log format. Only metrics from the standard Jupyter Server prometheus endpoint are gathered.
Currently no traces are observed for the Runtimes.
Non-working Instrumentation
Auto-instrumentation by the OpenTelemetry operator via a CRD Instrumentation was tried but it did not work. That CRD must be defined in the namespace the Pod is going to be created and the instrumentation will occur only at the Pod creation.
A Pod is selected for instrumentation if it gets some annotations. In this specific case, to instrument Python on a multi-container pod:
instrumentation.OpenTelemetry.io/inject-python: true
instrumentation.OpenTelemetry.io/container-names: "{RUNTIME_CONTAINER_NAME}"
See this README for more information and available options to be set through environment variables.
The Python auto-instrumentation is using HTTP to send data to the OpenTelemetry Collector.
Grafana
Grafana will be available on this URL.
open ${DATALAYER_RUN_URL}/grafana
If you did not set an admin password, it was set using a random string in Kubernetes secret. You can print it by executing the following command.
kubectl get secret --namespace datalayer-observer \
  -l app.kubernetes.io/name=grafana \
  -o=jsonpath="{.items[0].data.admin-password}" | base64 --decode
echo
Use the admin and the printed password credentials to connect via the Grafana Web page.
Grafana is the de-facto tool for exploring all telemetry (logs, traces and metrics); in particular the Explore panel.
Prometheus: Query using a label filter onservice_name(e.g. iam). It is usually easier than starting with a metric names as those are not standardize across services (neither in name nor in unit - that appears in the name).Loki: Query using a label filter onservice_name(e.g. iam). When clicking on a log entry, you will access its metadata and a link to the associated trace (if available).Tempo: Query the data using setting aService name. Traces are usually not the best places to start, better use logs that will link the associated trace.
On top of the standard technical stack (Pulsar, Ceph...) dashboards, we have prepared custom dashboards to help with the observation. The dashboards definitions are available in this grafana-dashboards GitHub repository.
Services
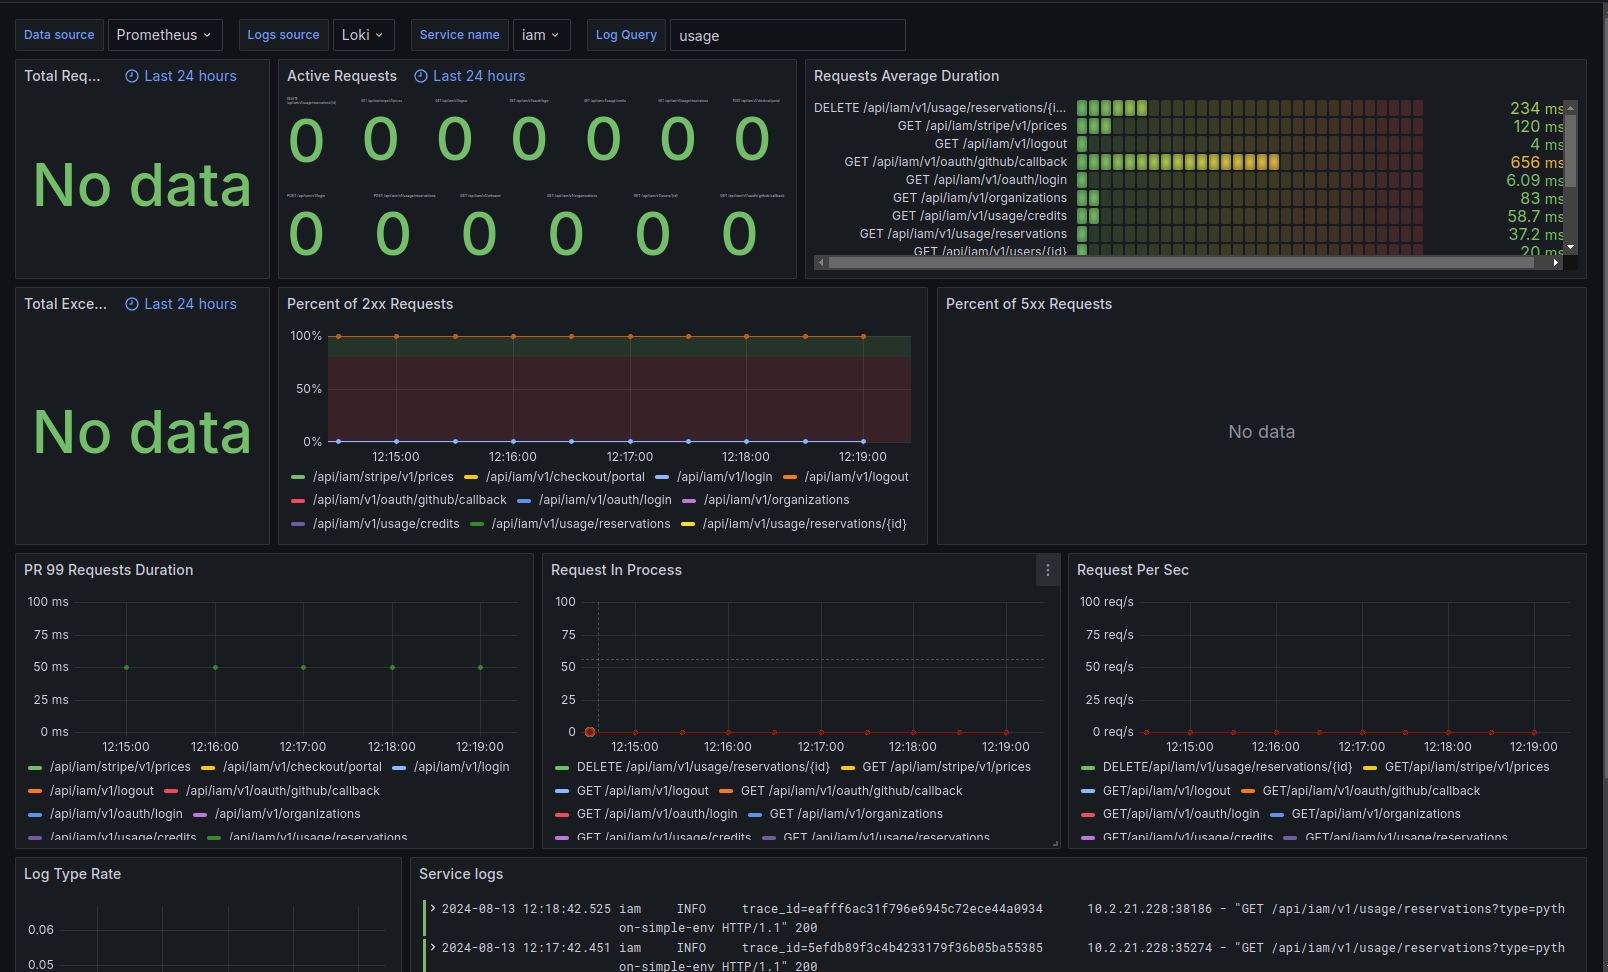
Main View
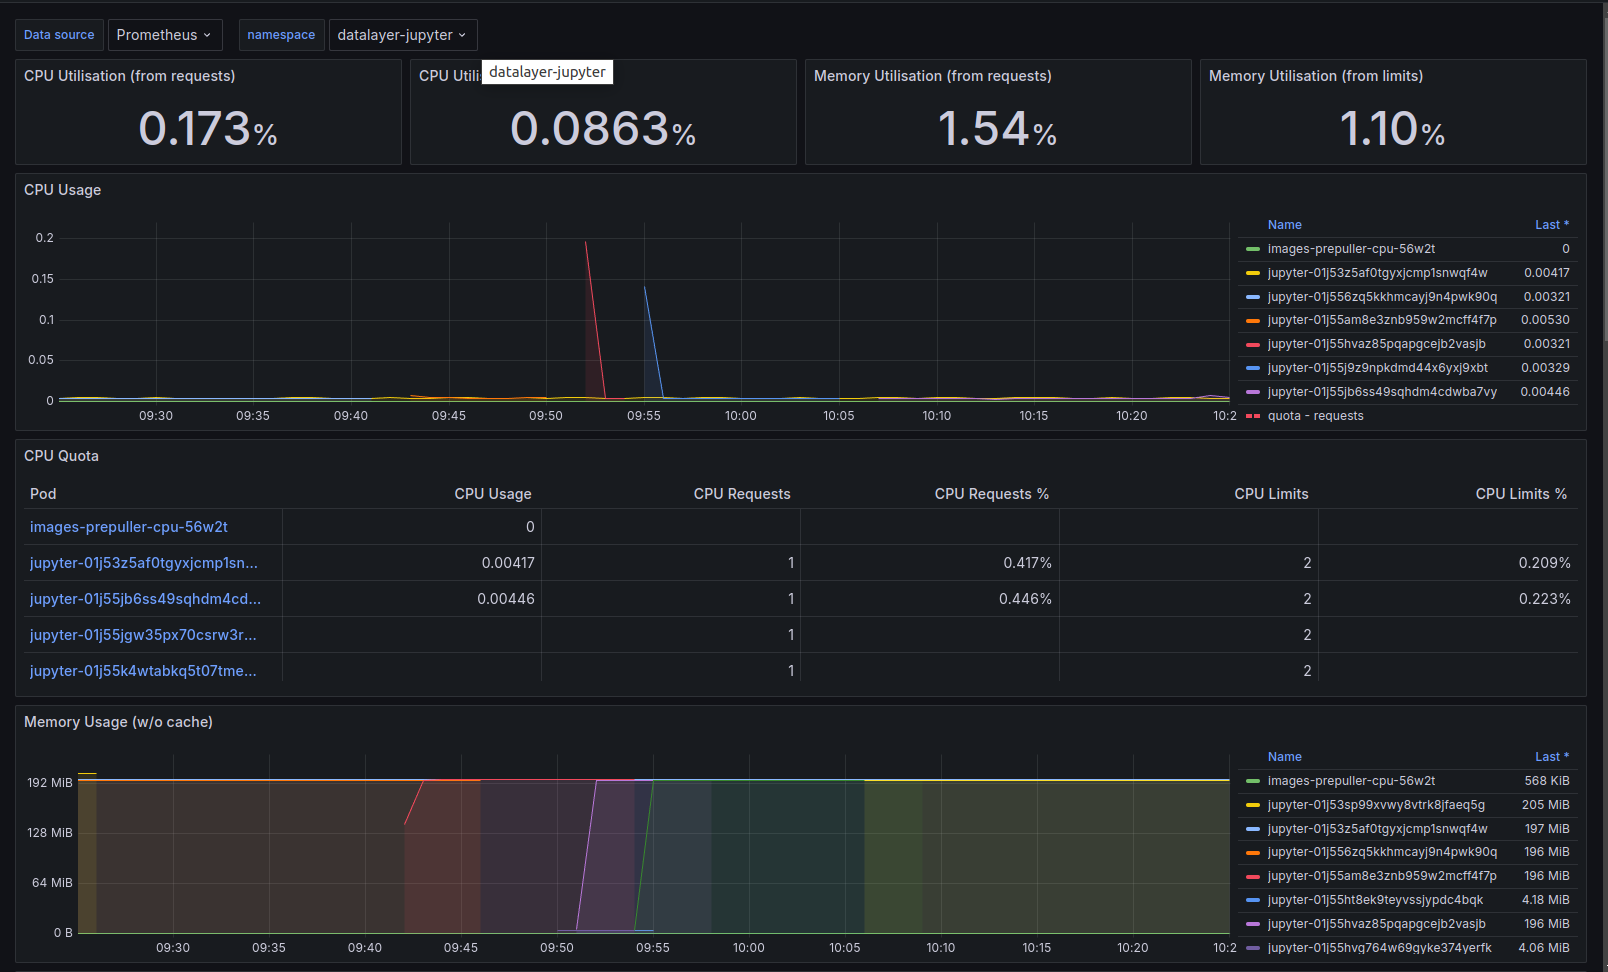
Detailed View